


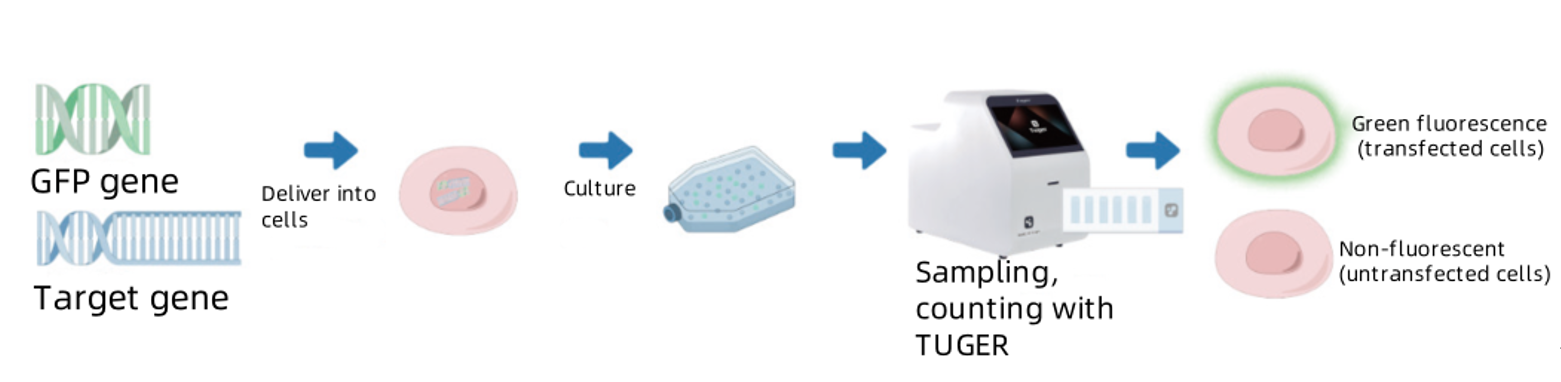
GFP Gene Transfection
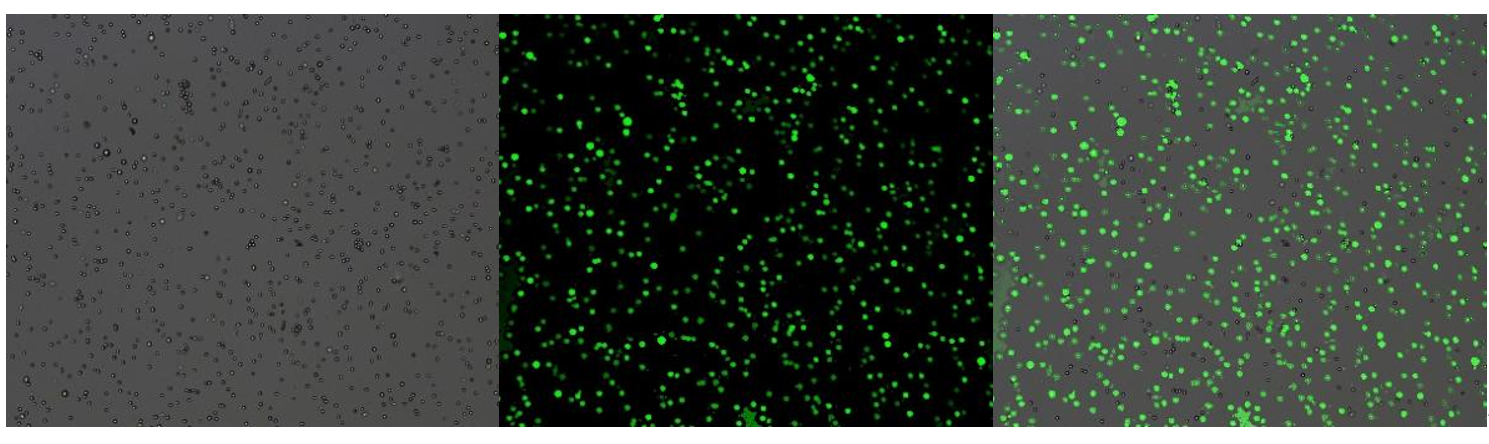
During the transfection experiment, the GFP gene was linked to the target gene and introduced into the target cells, resulting in co-expression of GFP and the target gene. Due to the fluorescent properties of GFP, the fluorescence signals in these cells can be detected using a fluorescence microscope or a fluorescence cell analyzer. By observing and counting the cells exhibiting green fluorescence, the expression and activity level of the target gene in the cells can be indirectly assessed.
Target:
Hela cells with varying transfection efficiencies were analyzed by both manual counting and fluorescence cell analyzer to validate the accuracy of the fluorescence cell analyzer in measuring GFP transfection.
Experimental scheme:
1、HeLa cells with high transfection efficiency marked by the GFP gene were mixed with non-transfected HeLa cells in specific proportions to obtain five cell samples with approximate transfection rates of 90%, 70%, 50%, 30%, and 10%, respectively. These samples were designated as Cell1, Cell2, Cell3, Cell4, and Cell5.;
2、Under a fluorescence microscope, Cell1 to Cell5 were counted respectively to calculate their transfection rates.;
3、Cell1 to Cell5 were respectively counted using the Tuger fully automated fluorescence cell analyzer, and their transfection rates were measured.
Result:

Fitting results of transfection rate between Tuger measurement and manual counting
Conclusion:
By comparing samples with different transfection rates, the results of manual counting and those obtained from the fully automated fluorescence cell analyzer showed that, within the transfection rate range of 10% to 90%, the Newtonoptic fully automated fluorescence cell analyzer provided accurate transfection rate measurements, with a counting correlation coefficient (R²) greater than 0.99.

National Advisory Service Hotline
Sales consultation: +86 15322248165(Whatsapp/Wechat)
E-mail:global@newtonoptic.com
R & D Center: Room 301, Floor 1, Building 1, No.38 Gaopu Road, Tianhe District, Guangzhou City, Guangdong Province

Follow Wechat Official Account
©2024 Guangzhou Newtonoptic Research Institute Co., Ltd. All rights reserved